
Feedback Analysis with Microsoft Power BI
Turn your data into immediate impact!
Microsoft Power BI enables you to create personalized dashboards and interactive reports by analyzing big data in real-time. You can connect your feedback data, combine other data sources to discover what’s important and make better business decisions.
Usersnap offers integration with Power BI, allowing you to analyze your feedback items more effectively. By leveraging Usersnap’s REST API, you can export data from specific endpoints and directly import it to PowerBI for further analysis.
Microsoft Power BIThis integration is only available with Premium and Enterprise plans.
Please be aware that this integration needs some customization on your side and is not plug&play.
Use cases
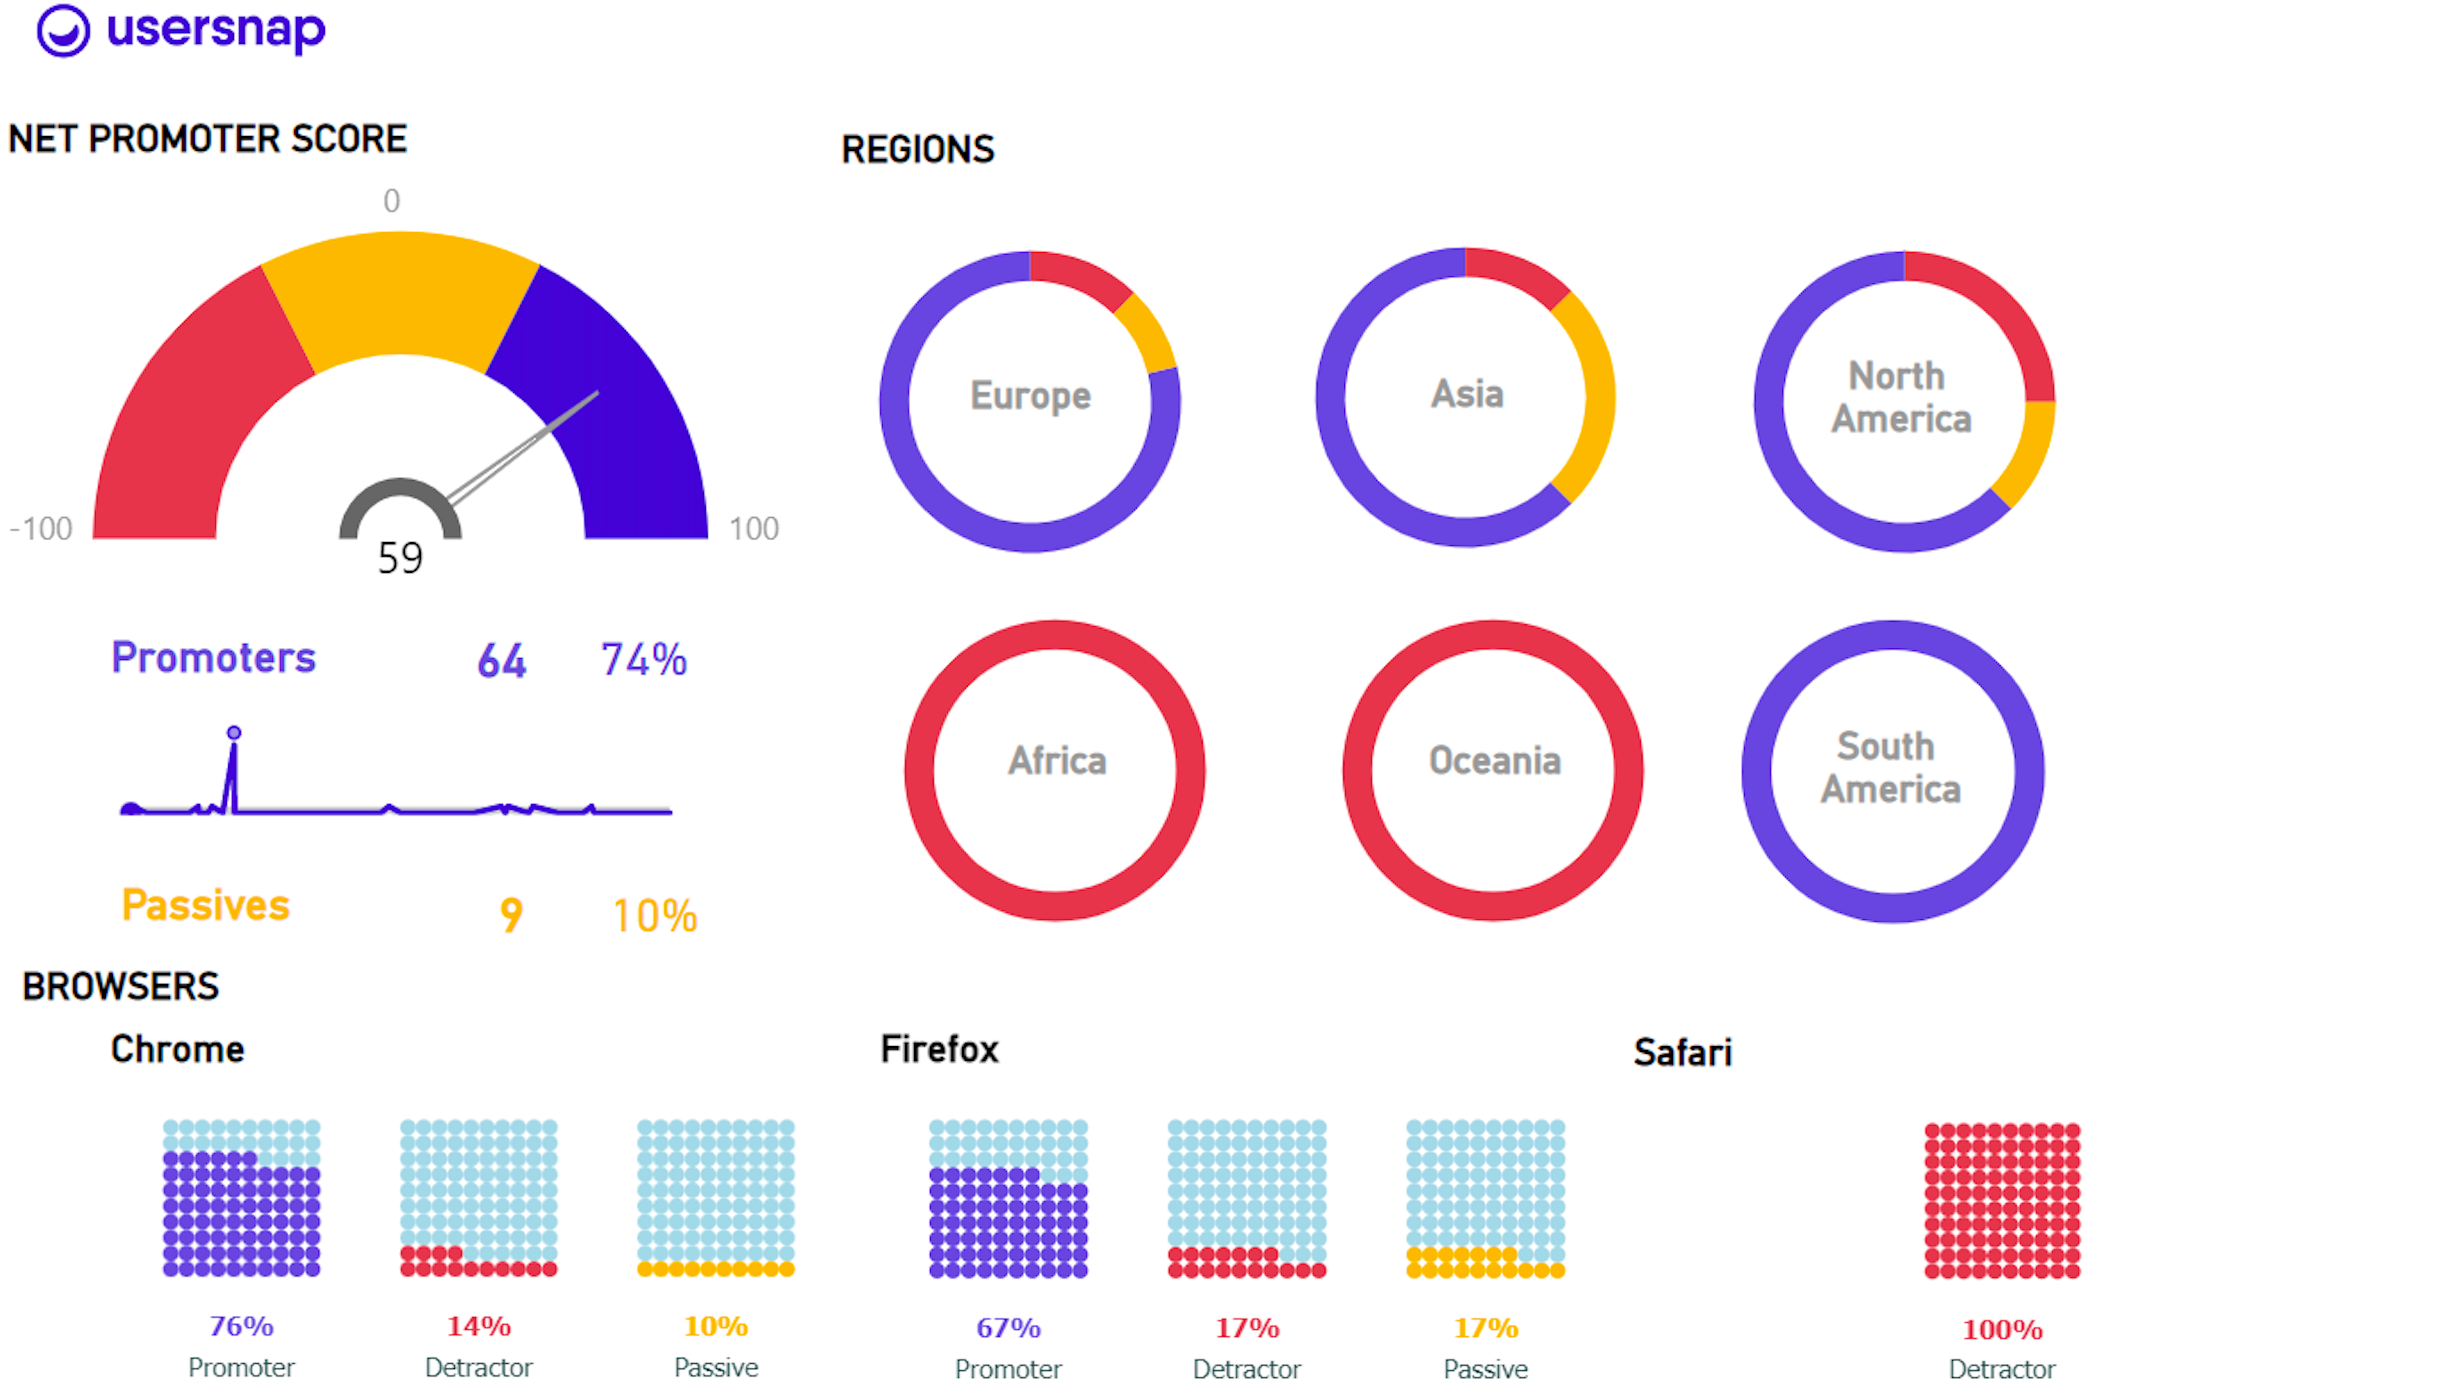
Dive deeper into customer satisfaction: with advanced filtering and sorting options, you can slice and dice your feedback data to see NPS by country or create segment reports on your different pricing options. Leverage this comprehensive data to make informed decisions and prioritize your international customer needs.
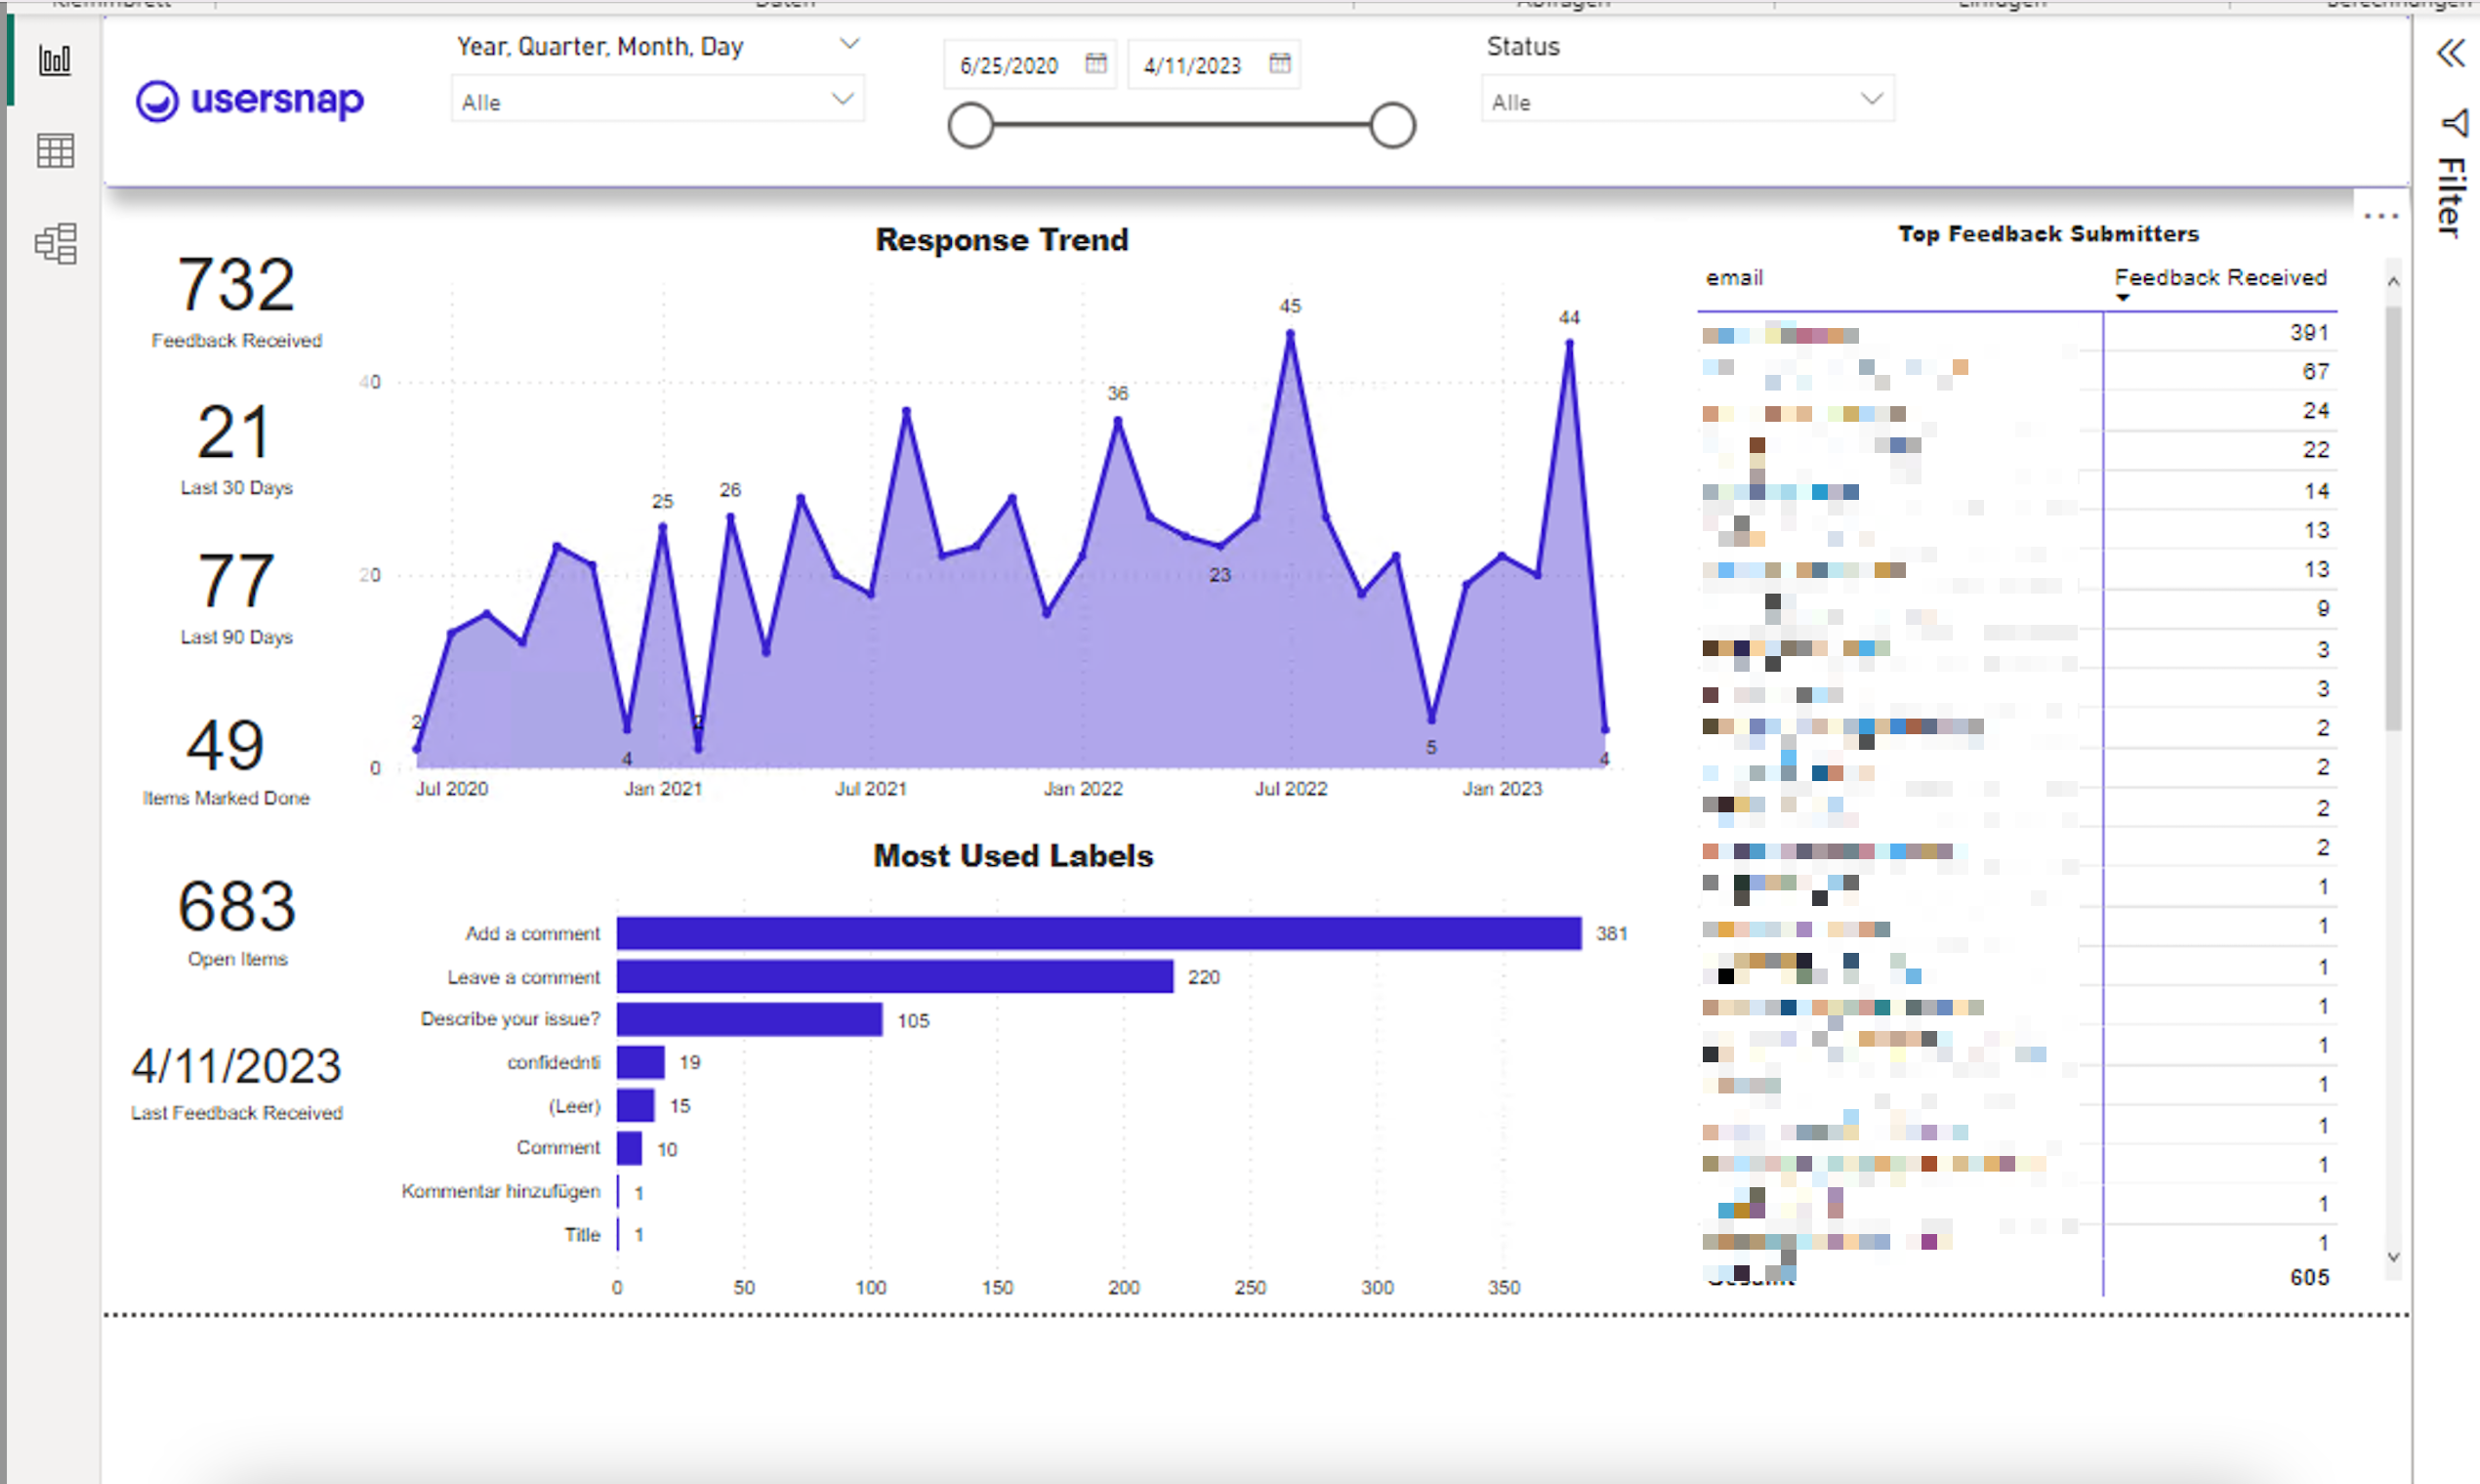
Combine NPS, CSAT, CES, and open-ended feedback: create advanced reports and get more context on the feedback that has been shared by combining quantitative and qualitative data. Monitor the progress and performance of projects in real-time by tracking what issues are closed vs. open.
Create a full customer profile: bring together different data sources such as long surveys, short surveys, product analytics, CRM data, and more to build a strategic account renewal for high-value customers.
Report Examples
The following screenshots showcase a couple of NPS & bug projects inside of Microsoft Power BI:
Usersnap's REST API with Microsoft Power BI
To help you connect Usersnap's REST API to Microsoft Power BI more easily, we've created two report files in the "pbix" format for you. These files can be uploaded into the Microsoft Power BI desktop application, providing example reports for bug tracking and Net Promoter Score (NPS) projects linked to several demo projects.
Download the Example Report "pbix" filesYou can download the NPS report here and the Bug report here.
Please be aware that these are only example reports for a bug reporting and an NPS project. For your own Usersnap reports you have to create separate custom reports in MS Power BI.
These files include an integration to our Usersnap REST API (for exporting feedback items) via Python. You'll find a python script in the pbix-files that connects to our REST API and gets the data of a bug reporting and an NPS project. Please adapt this to your needs.
Here's how you can load and configure the example reports:
Once you've loaded one of the report files in the Microsoft Power BI desktop, follow these steps:
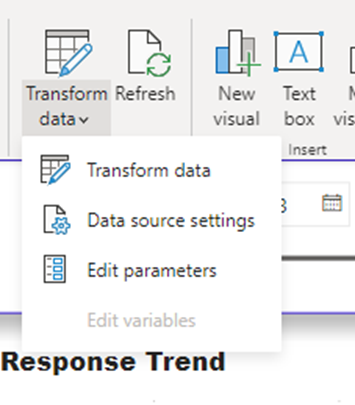
Navigate to 'Transform data' and then select 'Edit parameters'.
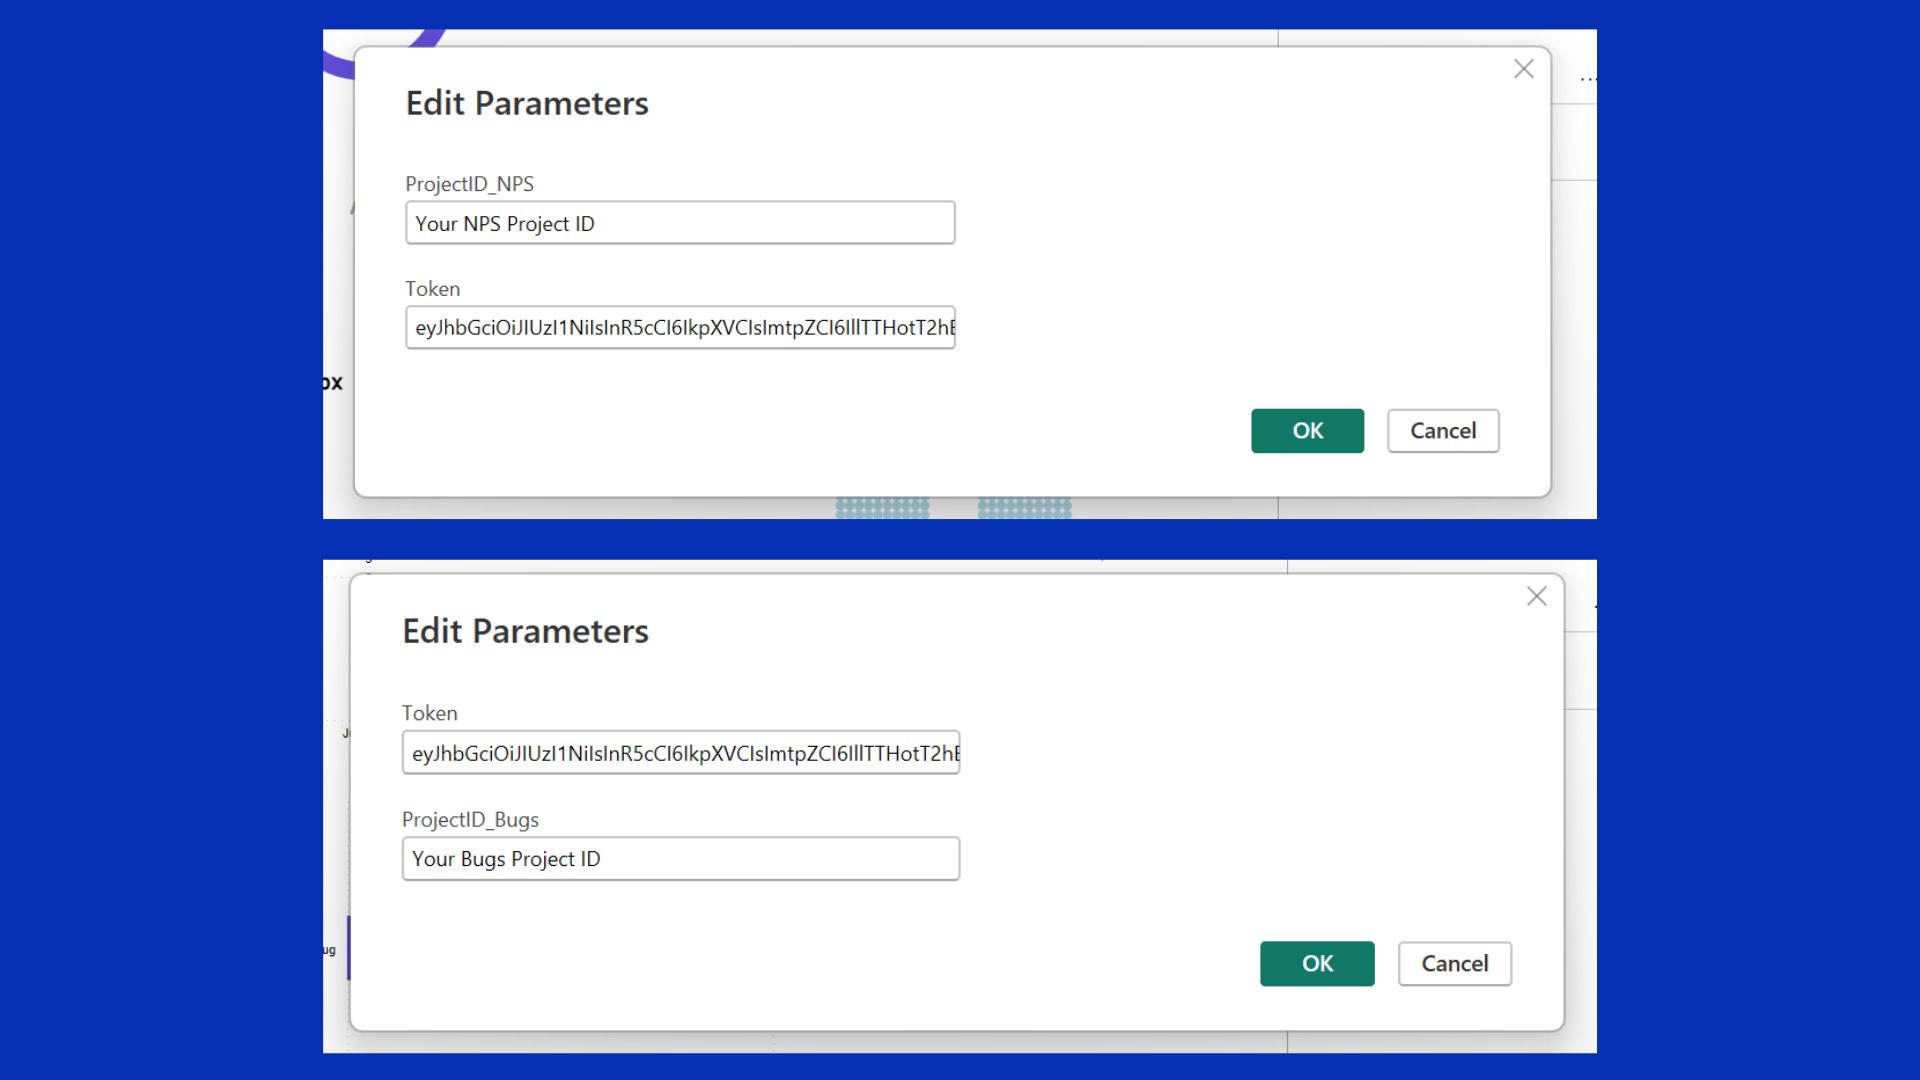
Next, input your JWT token into the designated 'token' field. Also, enter your NPS/Bugs project IDs into the corresponding 'ProjectID' fields:
Make sure to apply changes:

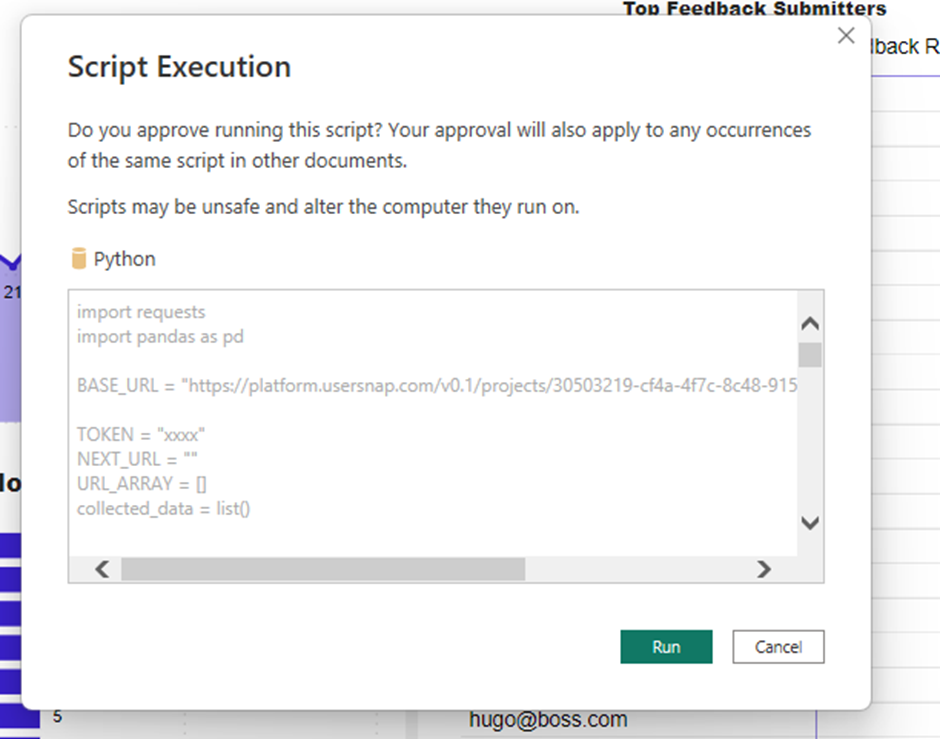
Next, you'll be required to authorize the script to run. Whenever you encounter the prompt shown below, click 'Run'.
Once the script is executed, Microsoft Power BI will attempt to link with Usersnap's REST API and import the specified projects. This process may take a few minutes. However, if you don't see any imported data even after waiting for 10 minutes, it could be due to incorrect credentials. Please verify your JWT token and project ID to ensure they've been entered accurately.
Required python packagesWhen running the script, please make sure that your Microsoft Power BI's python interpreter has the following required packages installed:
Also, when you want to use Usersnap's REST API for Microsoft Power BI, you can use the following authenticated REST API endpoints:
-
GET /v0.1/projects
This endpoint returns a list of projects you have access to, providing the project_id required for other endpoints. -
GET /v0.1/projects/project_id/feedbacks
This endpoint lists all feedback items in the project. It supports pagination with a limit and a pagination cursor (after or before). -
GET /v0.1/projects/project_id/feedbacks/count
This endpoint returns the total count of all feedback items in the project. It supports pagination for queries such as "how many feedback items are remaining after this one?". -
POST /v0.1/projects/project_id/feedbacks/filter
This endpoint allows you to filter feedback items based on multiple properties and select sorting criteria. For example, you can order by creation time and filter to only see feedback items marked as "done". -
POST /v0.1/projects/project_id/feedbacks/filter/count
This endpoint is similar to the normal count but takes a JSON with filters and ordering. The ordering only matters if you pass pagination as well.
For more information, please check out our REST API documentation alongside our Swaggerhub documentation for detailed information.
Updated about 1 year ago